There are two basic options for debugging the code in Trackable Entities. One is to fork, clone or download the source code from GitHub, then add the Visual Studio project to your solution and reference it from your app. The other is to use the debug symbols downloaded from a symbol server. This page describes the second option, which is much more straightforward.
Symbols and Source
To debug a .NET assembly, you need both the symbols file, more commonly referred to as a PDB file, and the source code. For an explanation of PDB files and how they relate to source code, see this article by John Robbins.
Visual Studio Debugging Options
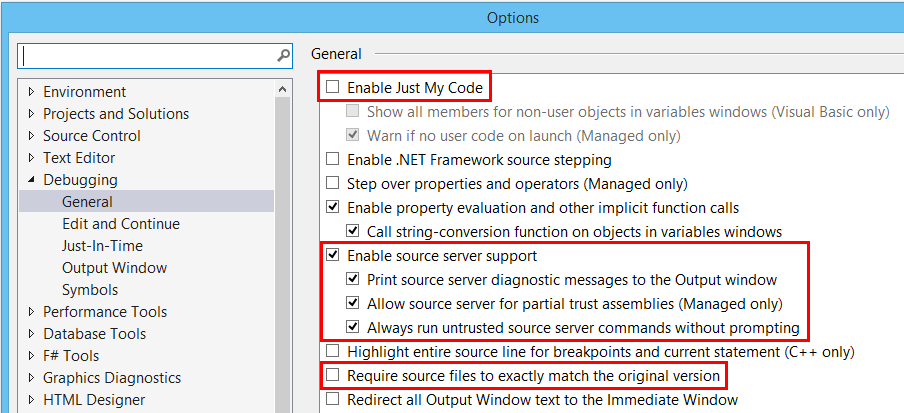
Before set up Visual Studio to debug referenced assemblies, you should set some debug options. You can set these by selecting Options and Settings from the Debug menu. Here are the recommended settings:
- Uncheck: Enable Just My Code
- Check: Enable source server support
- Uncheck: Require source files to exactly match the original source (optional)
Local Symbol Server
So how do you locate the PDB file and source code for an assembly you'd like to debug? Visual Studio has a built-in mechanism for downloading symbols and source from a symbol server, so that you can step right into the code of a referenced DLL from a breakpoint while you're in the middle of a debugging session.
JetBrains dotPeek
JetBrains, the folks who invented ReSharper, have a free .NET decompiler dotPeek. This tool has a very cool feature that allows you to set up a local symbol server that generates PDB and source files on the fly, so that you can step into the source code while debugging. You can find detailed instructions for setting up the dotPeek symbol server in this article.
Generating Symbols for Trackable Entities
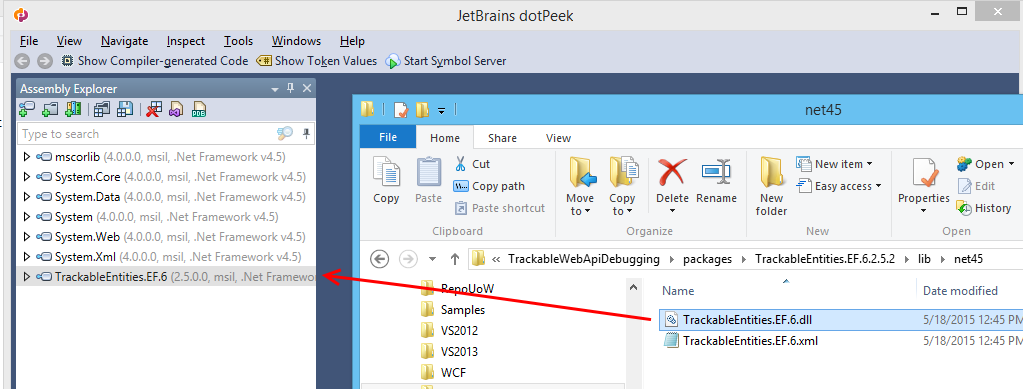
To set up dotPeek for serve up symbols for Trackable Entities, it's a good idea to add the DLL you'd like to debug to the dotPeek Assembly Explorer. First locate the installed Trackable Entities NuGet packages by right-clicking on the solution for the your app's project, and select Open Folder in File Explorer. From there drill down into the packages folder and open one of the Trackable Entities packages, then open the lib folder and locate the DLL for the referenced assembly. Then simply drag and drop the DLL onto dotPeek in order to add it to the Assembly Explorer.
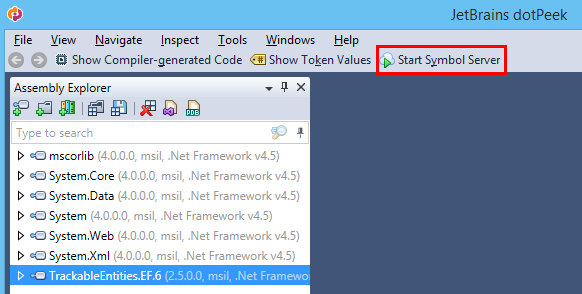
Click the Start Symbol Server button on the dotPeek toolbar.
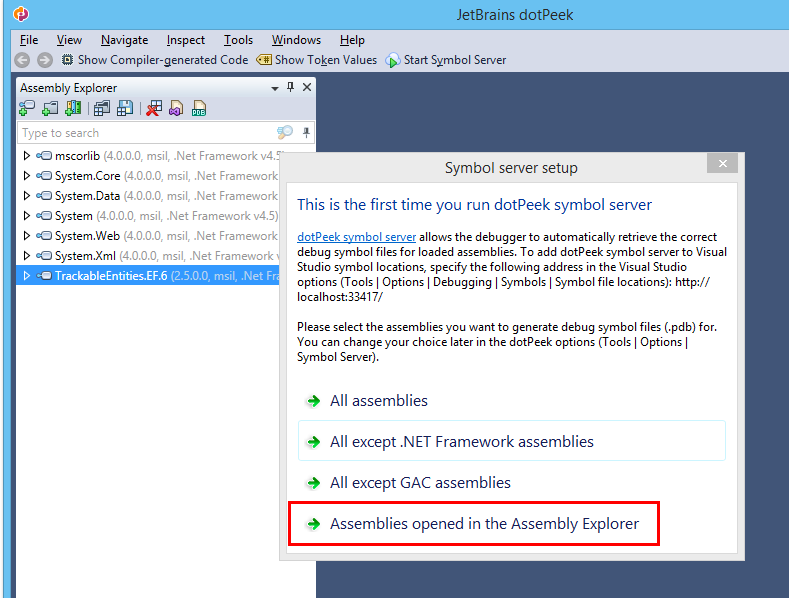
The first time you start the dotPeek symbol server, you'll be prompted to set the symbol server options. The most efficient approach is for the server to generate symbol files only for assemblies opened in the Assembly Explorer.
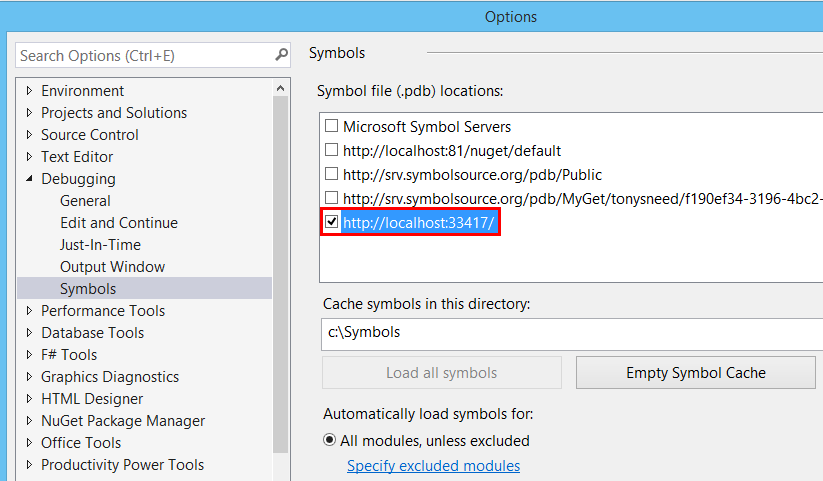
Visual Studio Symbol Server Options
In order for Visual Studio to use symbols and source provided by dotPeek, you'll need to got back to the Debug Options, select Symbols, and add a location with the dotPeek server URL: http://localhost:33417.
Set Breakpoints and Step Into Source Code
Next simply set a breakpoint on a line of code that calls a method from one of the Trackable Entities libraries. For example, you might want to step into the ApplyChanges extension method for DbContext from TrackableEntities.EF.6. First set the Web project as the solution startup project, then press F5 to debug your Web API or WCF service. When your client app invokes the service operation, you'll hit the breakpoint where ApplyChanges is called.
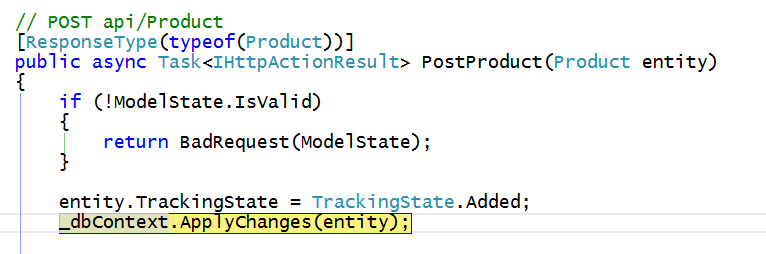
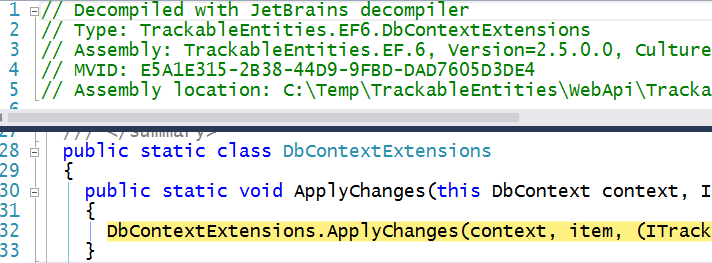
Pressing F11 at this point will step into the ApplyChanges method, so that you can use the debugging tools of Visual Studio to see how Trackable Entities is informing Entity Framework of change state for each entity in your object graph.
You can use this same approach to step into source code for any Trackable Entities assembly, both on the client and server.